Your quality data has been sitting in a silo. Not anymore.
Quality data has a habit of living apart from everything else, a PDF here, a spreadsheet there, an inspection report nobody outside the QC team ever opens. And it's not just quality data. Across your supply chain, information that could shape real commercial decisions rarely makes it out of the system it was created in.
Qarma has always been built to pull that data together, which supplier is slipping, whether a recurring defect is a supplier problem or a process problem, what a claim actually traces back to. That's not new. What's new is how much easier it now is to see it, act on it, and bring it into the room.
That's what today's release is about. Watch the full video below
New management-style dashboards
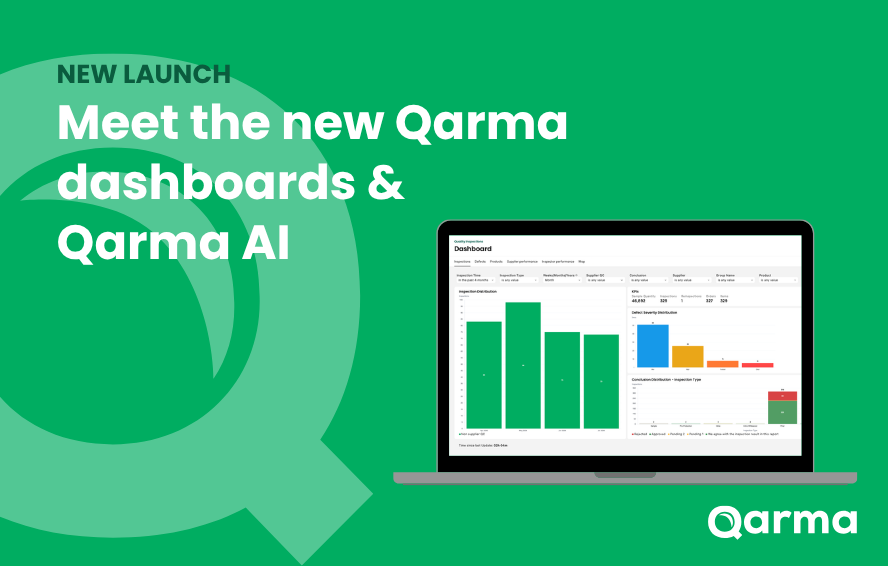
The dashboard has been rebuilt from the ground up, and it's now organized into focused, tab-based views built for the conversations you're actually having, with your team, with suppliers, and with leadership:
- Inspections: a quick read on volume, conclusions, and defect severity
- Defects: trends over time, plus a defect gallery
- Supplier performance: every supplier's inspection count, defect rate, and rejection rate, side by side, so it's immediately clear who's performing and who's costing you
- Inspector performance: the same, but for your inspection team
- Products: defect and rejection rates by product
- Map: every inspection, plotted geographically
Right alongside it, the new Product Compliance dashboard tracks every document your suppliers and products need to stay compliant. See what's approved, what's overdue, and what's still sitting untouched in draft, all in one view. No more chasing spreadsheets or emailing three people to find out who's missing what. Just a clear answer to the question that actually matters: who's compliant, and who isn't.
And in addition, we're also introducing Supplier Compliance dashboards. Built to show progress, not just position. The dashboard combines audit scores, corrective action follow-through, KPIs, and document status for every supplier and production unit. A supply chain wide map of gaps and development. Look forward to a card for any single supplier or production unit, with their audit and performance history laid out in one place. Keep proper track of corrective actions and see which non-conformities are falling behind in closure.
None of this data is new to Qarma. What's new is not having to export reports and rebuild the same chart every month, you get a live view you can bring straight into a supplier review or a leadership meeting.
Qarma AI: trends, not just tables
Alongside the dashboard, we're launching Qarma AI, built to help you spot the trends sitting inside your inspection data instead of digging for them manually.
The question we hear most from quality and sourcing teams isn't "what happened", it's "why does this keep happening." Is a recurring defect tied to one supplier, or is it showing up across your whole supply chain? Is it a training issue on the factory floor, or a process issue further upstream? Qarma AI is built to help answer that.
Some questions that might be useful as you figure out how to prompt:
- Which defect categories / types are growing in 2026 compared to 2025?
- Which suppliers are driving these trends?
- Which office chair* suppliers are performing best right now? (* or other product category)
- Prepare preliminary numbers for our CSRD reporting for 2026
- Where do we see the biggest health and safety risks in our supply chain
- Show the top 10 factories where we have most outdated or missing compliance documentation
- Which suppliers have most outstanding document uploads? And which product categories and types of documents?
- How many of our products fall under EUDR in 2026
- How has the number of active production units evolved from 2025 to 2026?
- Which suppliers have grown most in defect rate and what defect types are driving this?
Qarma AI is in open beta, and we're keeping it deliberately small while we learn, 4 sign-ups per account. If you want in, grab one of those spots by signing up here: qarmainspect.com/trial-qarmaai
Why this matters beyond the dashboard itself
This release isn't about doing something new – it's about making the connections Qarma already lets you make faster to get to and easier to act on:
- Buyers and sourcing teams can see, at a glance, who actually delivers good product, not from memory, but from a live supplier performance and compliance view..
- Tracing a claim back to the PO and the defect that caused it is now a click, not a spreadsheet exercise.
- Telling whether a quality problem is a supplier issue or a process issue is visible in the dashboard itself, not something you have to reconstruct after the fact.
Quality data was never meant to stop at the inspection report. Now it's even easier for it not to.